The Ledger 2030 Global Power Forecast
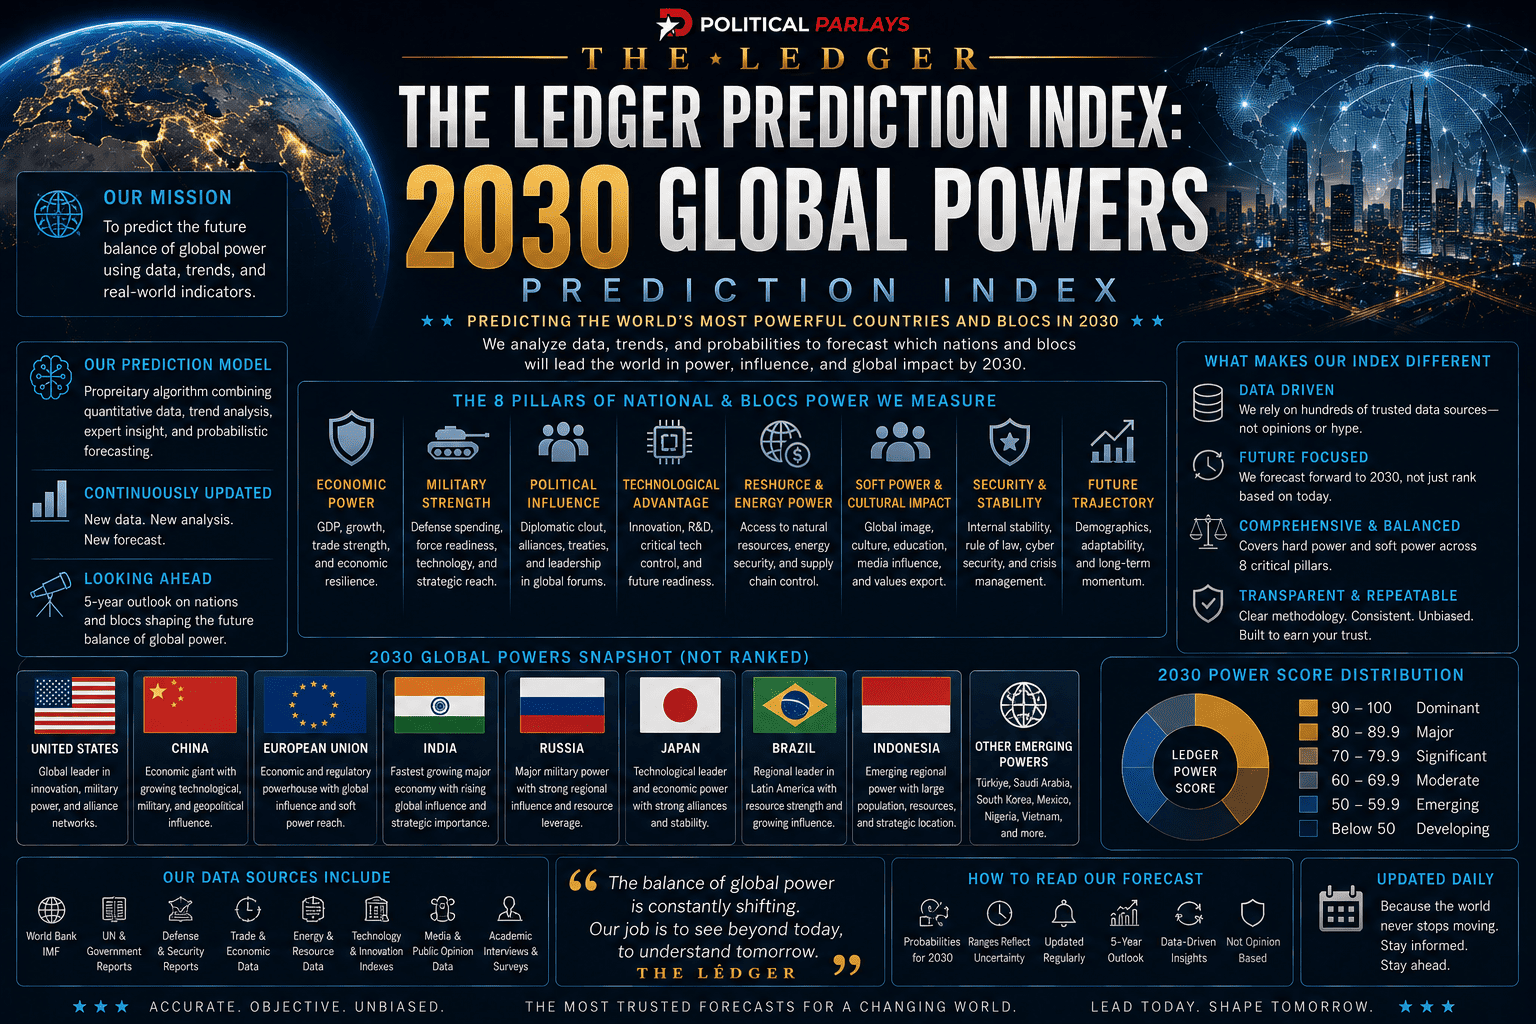
The 100 Countries Projected to Hold the Greatest Global Influence in 2030
The Ledger 2030 Global Power Forecast looks beyond today’s hierarchy to estimate which nations are most likely to possess the greatest ability to shape global politics, economics, security, technology and international affairs at the beginning of the next decade.
This is not simply a GDP forecast.
Countries are assessed through The Ledger’s Six Pillars and Eight Pressure Tests, with additional weight given to trajectory, demographics, technological capacity, defense investment, energy security, manufacturing strength, alliance networks and strategic geography.
| Rank | Country | Primary Power Base |
|---|---|---|
| 1 | United States | Military, Finance, Technology, Alliances |
| 2 | China | Manufacturing, Economy, Technology, Military |
| 3 | India | Demographics, Economy, Technology, Geopolitics |
| 4 | Russia | Military, Nuclear, Energy, Geography |
| 5 | United Kingdom | Finance, Defense, Diplomacy, Intelligence |
| 6 | Germany | Economy, Industry, European Influence |
| 7 | Japan | Technology, Economy, Industry, Indo-Pacific |
| 8 | France | Nuclear, Military, Diplomacy, European Influence |
| 9 | Saudi Arabia | Energy, Capital, Middle East Power |
| 10 | South Korea | Technology, Manufacturing, Defense |
| 11 | Brazil | Resources, Agriculture, Demographics |
| 12 | Türkiye | Military, Geography, Regional Diplomacy |
| 13 | Indonesia | Demographics, Resources, Indo-Pacific |
| 14 | Israel | Technology, Defense, Intelligence |
| 15 | United Arab Emirates | Capital, Trade, Technology, Diplomacy |
| 16 | Canada | Resources, Finance, Geography, Alliances |
| 17 | Italy | Economy, Industry, Mediterranean Influence |
| 18 | Australia | Resources, Indo-Pacific Security, Alliances |
| 19 | Iran | Energy, Military, Regional Influence |
| 20 | Mexico | Manufacturing, Trade, Demographics |
| 21 | Spain | Economy, EU Influence, Global Relations |
| 22 | Netherlands | Trade, Semiconductors, Finance |
| 23 | Poland | Defense, European Security, Manufacturing |
| 24 | Singapore | Finance, Trade, Technology |
| 25 | Switzerland | Finance, Diplomacy, Innovation |
| 26 | Taiwan | Semiconductors, Technology, Strategic Geography |
| 27 | Egypt | Geography, Suez, Demographics |
| 28 | Pakistan | Nuclear, Demographics, Strategic Geography |
| 29 | Nigeria | Demographics, Energy, African Influence |
| 30 | Vietnam | Manufacturing, Growth, Indo-Pacific |
| 31 | Qatar | Energy, Capital, Diplomacy |
| 32 | South Africa | Finance, Resources, African Influence |
| 33 | Sweden | Technology, Defense, Industry |
| 34 | Norway | Energy, Sovereign Capital, NATO |
| 35 | Ukraine | European Security, Defense, Strategic Geography |
| 36 | Malaysia | Manufacturing, Trade, Semiconductors |
| 37 | Thailand | Manufacturing, Tourism, Southeast Asia |
| 38 | Philippines | Demographics, Indo-Pacific Geography |
| 39 | Argentina | Agriculture, Energy, Critical Minerals |
| 40 | Belgium | EU/NATO Institutions, Trade |
| 41 | Denmark | Shipping, Energy, Technology |
| 42 | Austria | Finance, Central European Influence |
| 43 | Finland | Technology, Defense, NATO |
| 44 | Czech Republic | Manufacturing, Defense, Central Europe |
| 45 | Kazakhstan | Energy, Uranium, Strategic Geography |
| 46 | Algeria | Energy, North African Influence |
| 47 | Morocco | Manufacturing, Trade, Africa-Europe Gateway |
| 48 | Bangladesh | Demographics, Manufacturing |
| 49 | Iraq | Energy, Middle East Geography |
| 50 | Greece | Shipping, Mediterranean Geography |
| 51 | Romania | European Security, Energy, Black Sea |
| 52 | Chile | Copper, Lithium, Pacific Trade |
| 53 | Colombia | Demographics, Resources, Regional Influence |
| 54 | Peru | Copper, Mining, Pacific Trade |
| 55 | Portugal | Atlantic Geography, EU, Energy |
| 56 | Ireland | Technology, Finance, Transatlantic Investment |
| 57 | New Zealand | Agriculture, Indo-Pacific Alliances |
| 58 | Uzbekistan | Demographics, Central Asian Growth |
| 59 | Azerbaijan | Energy, Caucasus Geography |
| 60 | Serbia | Balkans, European Strategic Position |
| 61 | Hungary | Manufacturing, Central European Politics |
| 62 | Ethiopia | Demographics, African Diplomacy |
| 63 | Kenya | East African Finance, Technology, Logistics |
| 64 | Angola | Energy, Resources |
| 65 | Democratic Republic of the Congo | Critical Minerals, Demographics |
| 66 | Mongolia | Critical Minerals, China-Russia Geography |
| 67 | Oman | Energy, Maritime Geography, Diplomacy |
| 68 | Kuwait | Energy, Sovereign Capital |
| 69 | Bahrain | Finance, Gulf Security |
| 70 | Jordan | Diplomacy, Middle East Security |
| 71 | New Zealand | Agriculture, Indo-Pacific Influence |
| 72 | Panama | Canal, Logistics, Finance |
| 73 | Cuba | Caribbean Geography, Diplomatic Legacy |
| 74 | Venezuela | Oil, Resources, Regional Politics |
| 75 | Ecuador | Energy, Agriculture, Pacific Geography |
| 76 | Bolivia | Lithium, Natural Resources |
| 77 | Ghana | West African Stability, Resources |
| 78 | Tanzania | Demographics, Indian Ocean Trade |
| 79 | Côte d’Ivoire | West African Economy, Trade |
| 80 | Senegal | West African Diplomacy, Stability |
| 81 | Rwanda | Regional Diplomacy, Technology |
| 82 | Mozambique | LNG, Indian Ocean Geography |
| 83 | Namibia | Critical Minerals, Energy |
| 84 | Botswana | Minerals, Institutional Stability |
| 85 | Tunisia | Mediterranean Geography, Manufacturing |
| 86 | Libya | Oil, Mediterranean Geography |
| 87 | Georgia | Caucasus Transit, Strategic Geography |
| 88 | Armenia | Caucasus Geopolitics, Technology |
| 89 | Sri Lanka | Indian Ocean Geography |
| 90 | Nepal | India-China Geography |
| 91 | Dominican Republic | Caribbean Economy, Trade |
| 92 | Costa Rica | Technology, Nearshoring, Stability |
| 93 | Uruguay | Agriculture, Stability, Technology |
| 94 | Paraguay | Agriculture, Energy |
| 95 | Lithuania | Baltic Security, Technology |
| 96 | Estonia | Digital Government, Cybersecurity |
| 97 | Latvia | Baltic Security, Logistics |
| 98 | Slovenia | EU Industry, Logistics |
| 99 | Croatia | Adriatic Geography, EU Integration |
| 100 | Iceland | Arctic Geography, Energy |
Why the United States Remains #1
The forecast does not assume that China automatically passes the United States by 2030.
The United States continues to possess an unusually broad combination of advantages: military reach, reserve-currency power, deep capital markets, leading technology companies, artificial-intelligence infrastructure, universities, energy resources and an alliance system that reaches across Europe and the Indo-Pacific.
China can close the gap substantially without necessarily overtaking the United States.
The critical question through 2030 will be whether American technological, financial and alliance advantages remain stronger than China’s manufacturing scale, industrial policy and expanding geopolitical reach.
Why China Remains the Primary Challenger
China’s strength is increasingly structural.
It possesses extraordinary manufacturing capacity, enormous infrastructure, technological depth, a large domestic market and growing military capability.
Its influence in electric vehicles, batteries, solar power, telecommunications, industrial equipment and supply chains gives it leverage extending far beyond conventional measures of national power.
China also continues rapidly expanding low-emissions electricity generation, with the IEA projecting enormous additions of solar and nuclear power through 2030.
The principal constraints remain demographics, financial-system pressures, geopolitical resistance and a less extensive alliance network than that of the United States.
Why India Rises to #3
India may represent the most significant upward movement among the world’s major powers.
Its advantages are increasingly complementary:
A huge population.
Rapid economic growth.
A large technology workforce.
Increasing manufacturing capacity.
Nuclear weapons.
A growing military.
Space capabilities.
Strong relationships with both Western and developing countries.
And an unusually flexible geopolitical position.
India does not need to replace either the United States or China to become more powerful.
It can gain influence by becoming increasingly indispensable to both.
By 2030, that combination could make India a more multidimensional global power than nations whose current influence relies disproportionately on military capability or legacy institutions.
Why Russia Remains Near the Top
Russia illustrates why The Ledger is not a GDP ranking.
Its economic scale alone would not justify a position near the top.
Its nuclear arsenal, military capacity, geography, natural resources, energy production and ability to affect European and Asian security do.
Russia was the world’s third-largest military spender in 2025, according to SIPRI.
The uncertainty is trajectory.
Russia’s 2030 position will depend heavily on economic resilience, demographics, relationships with China and India, technological capacity and the long-term consequences of its conflicts and international isolation.
Why Europe Remains Powerful
European power is frequently underestimated because it is fragmented across multiple sovereign nations.
Germany remains an industrial heavyweight.
France possesses nuclear weapons, global military capabilities and extensive diplomatic reach.
The United Kingdom combines finance, intelligence, nuclear capability and global relationships.
Poland is rapidly becoming more important to European security.
Meanwhile, NATO’s European members are sharply increasing defense spending.
That matters for a 2030 forecast.
A Europe investing substantially more in defense while retaining its enormous economic, regulatory, scientific and industrial base could exercise greater hard power by 2030 than it does today.
The Rise of the Middle Powers
The most interesting part of the 2030 forecast may not be the top four.
It may be the countries immediately beneath them.
Saudi Arabia, Türkiye, Indonesia, the UAE, Brazil, South Korea and Mexico increasingly possess enough economic or strategic leverage to influence competition among the world’s largest powers.
These countries do not necessarily need to choose one geopolitical bloc.
Their ability to negotiate with multiple sides can itself become a source of power.
Energy, Technology and Geography Matter More
By 2030, power will increasingly depend on what a country controls within critical systems.
Semiconductors.
Artificial intelligence.
Electricity.
Energy.
Critical minerals.
Shipping.
Data centers.
Manufacturing.
Financial networks.
Strategic waterways.
Countries controlling essential pieces of these systems can exercise influence far beyond what population or GDP alone would suggest.
Taiwan is perhaps the clearest example.
Chile’s copper and lithium resources matter.
The Gulf’s energy and sovereign capital matter.
The Netherlands’ semiconductor-equipment ecosystem matters.
Singapore’s position inside global trade and finance matters.
The Ledger attempts to capture those forms of leverage.
How the Forecast Is Built
The 2030 Global Power Forecast uses The Ledger’s Six Pillars:
Influence
Power
Momentum
Media Presence
Global Relations
Sentiment
Every country is then pressure-tested through:
Political Power
Economic Power
Military & Security
Technology & Innovation
Global Reach
Decision Authority
Replaceability
Systemic Impact
For the 2030 forecast, five additional forward-looking considerations receive greater emphasis:
Economic Trajectory — Is the economy gaining or losing relative global weight?
Demographic Position — Does the country possess the people and workforce necessary to support future growth?
Strategic Independence — How dependent is the country on other nations for energy, technology, food, capital and security?
Future Systems Control — Will it control important technologies, resources, infrastructure or supply chains?
Alliance & Coalition Potential — Can it build relationships that multiply its national power?
Editorial Standard
The Ledger 2030 Global Power Forecast is a structured projection rather than a declaration of certainty.
It does not predict which government will be in office, which wars will occur or which unexpected technologies will reshape the decade.
Instead, it asks:
Based on the structural forces visible today, which nations appear best positioned to shape the world in 2030?
The rankings will evolve as those structural forces change.